Thematic mapping with ArcGIS
1. Objectives
Thematic mapping with ArcGIS
• to produce a map of disaster (or related subject) distribution
• to be able to link existing tables to a shapefile (use the Join function in ArcGIS)
• to be able to independently design and produce a thematic map with printing quality
• note: you may choose a topic other than disaster under the consent of the instructor
2. Available data
For the map of the United States, please check my ftp site at ftp.ecn.purdue.edu\jshan\ce508. You can copy the link ftp://ftp.ecn.purdue.edu/jshan/ce508 to the top path panel in Windows Explorer (not Internet Explorer)
here
You need to find the thematic data yourself. The theme of the maps will be disaster management. The disasters to be considered may include, but are not limited to, the following
• earthquakes
• flood
• hurricane
• tornado
• storms
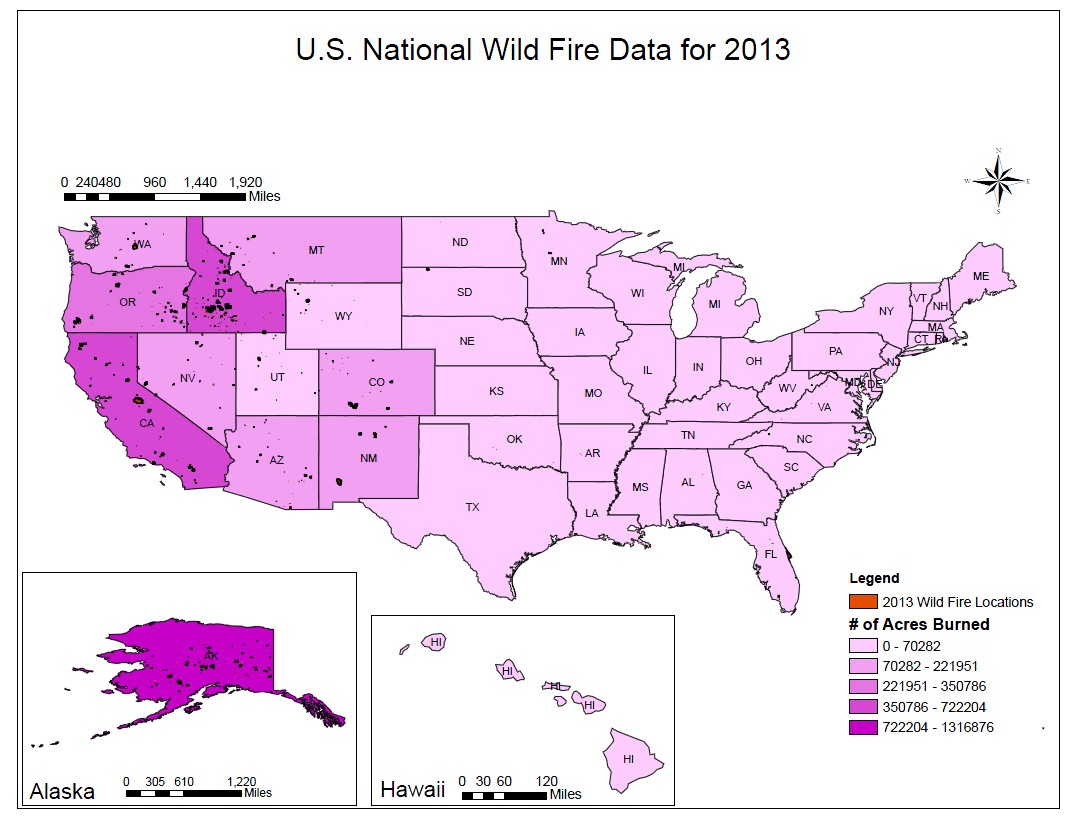
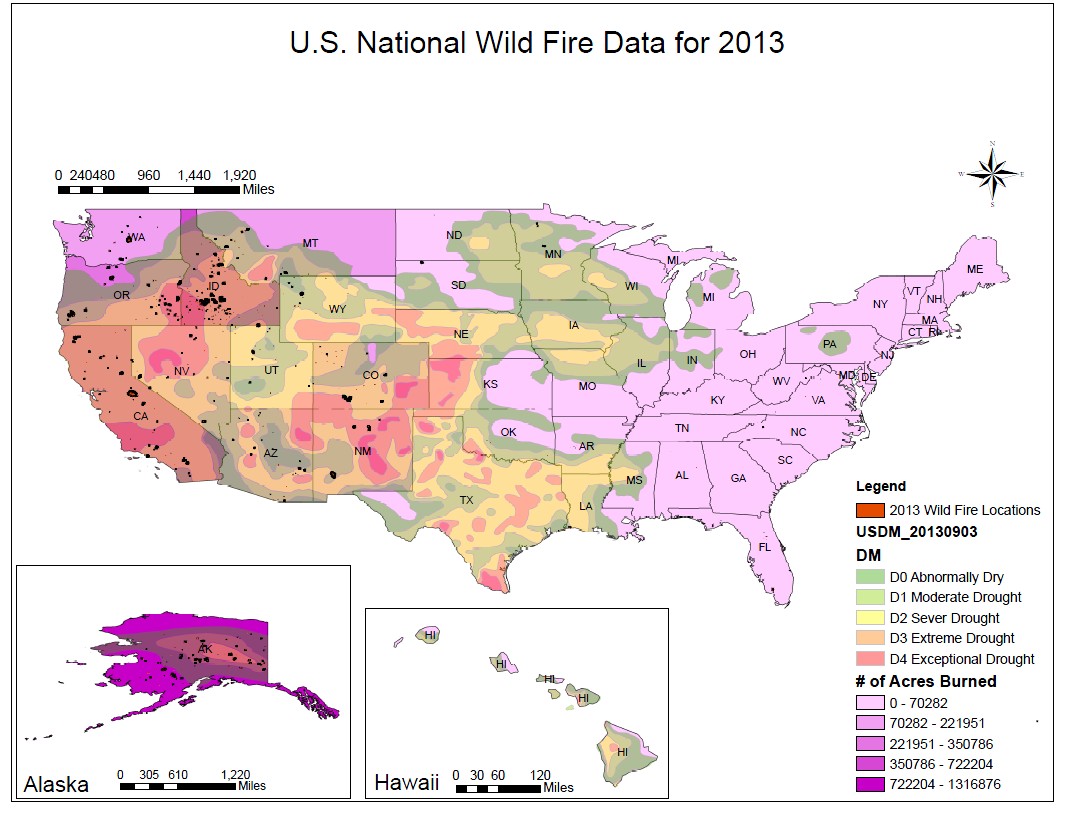
• wildfire
• disease of human beings or animals or crops
• other hazards
• terror attacks, crimes
• campus gunshots
A list of some public data sources:
• http://www.fema.gov . A lot of disaster management info.
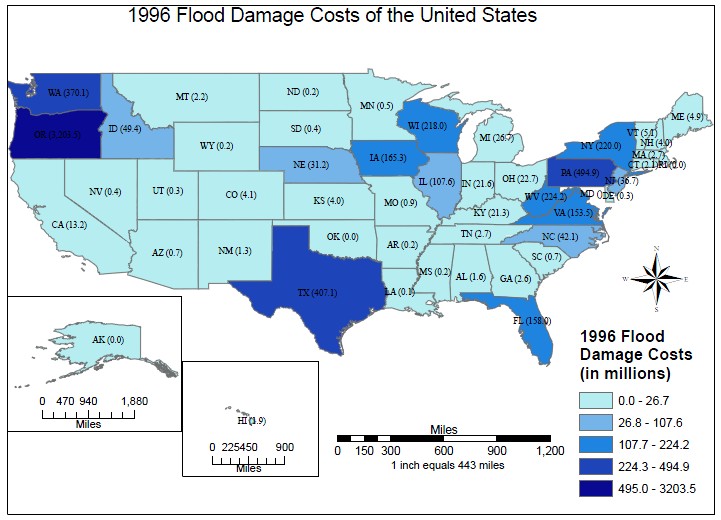
• http://www.flooddamagedata.org/states.html. Flood Damage Data for States: (A non governmental website that monitors damage caused by floods. The data is collected from different agencies, including The National Weather Service).
• http://www.cdc.gov. The Centers for Disease Control and Prevention (CDC) is the lead federal agency for protecting the health and safety of the people.
• http://www.cdc.gov/ncidod/dvbid/westnile/surv&controlCaseCount03_detailed.ht m, West Nile Virus
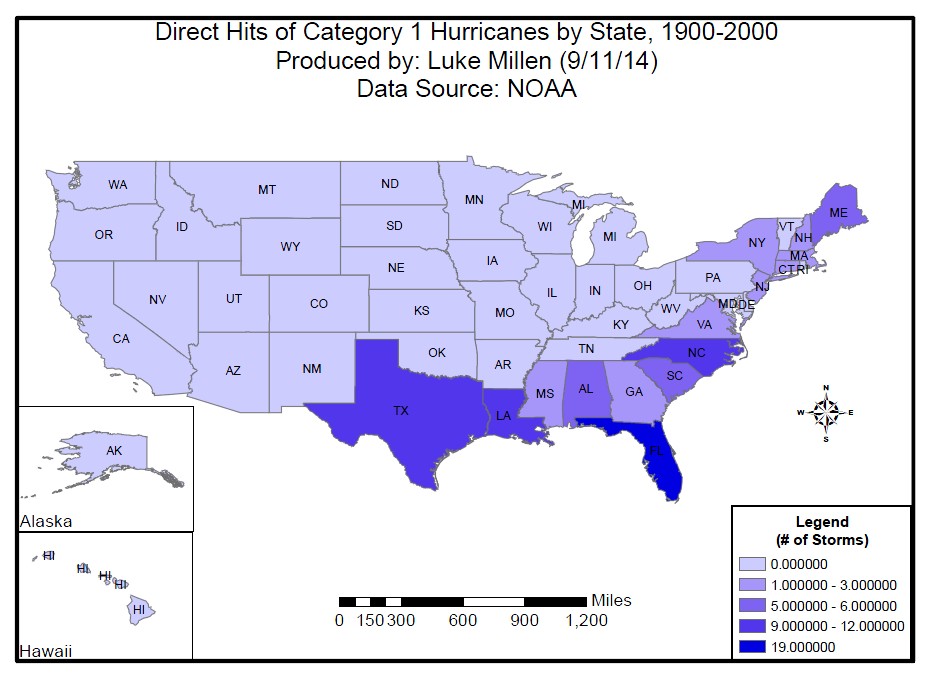
• Statewide Hurricane hits: http://www.aoml.noaa.gov/hrd/Landsea/deadly/Table9.htm http://www.nhc.noaa.gov/paststate.html
• http://www.aoml.noaa.gov/hrd/Landsea/deadly/index.html, (This is a link to a paper which has further links to other datasets)
• http://www.nifc.gov/, Forest Fires
Please note. Calculations can be done across several columns in the table when needed. Therefore, one thematic map is not necessarily only for one column or field in the table. The map can show the combination of several columns, such as the population density (Population/Area) or disaster per year (total #disasters/total #years). You have various possibilities to choose a topic for the thematic map.
3. Requirements (please read carefully)
Submit through Blackboard (all in ONE zipped file !)
o a report in *.doc format (max 2 pages) o disaster data in *.dbf or *.xsl format o a map of Letter size in pdf format
To be described/discussed in your report
o Topic selection and its significance
o Map design (including necessary data preprocessing)
o The data classification method used/selected
o Outcome analysis and interpretation (patterns found)
o Others that you are interested
final maps and possible appendices would not count towards the page limit
Note the following items apply to all reports during the course
The report should be
o In Letter format
o With Font: Time (or Times New Roman), size 12, 1.5 line spacing
o 1” margin on all sides
Sample results and graphics should be included in your report for analysis
The final map product should be in printing quality (i.e., properly designed, including all necessary map components, ready for final publishing). It can be an appendix to your report
The final map should be in Letter format with 1” margins on all sides
2003 West Nile Virus Activity (an example)

4


5
6
You need to find the thematic data yourself. The theme of the maps will be disaster management. The disasters to be considered may include, but are not limited to, the following
• earthquakes
• flood
• hurricane
• tornado
• storms
• wildfire
• disease of human beings or animals or crops
• other hazards
• terror attacks, crimes
• campus gunshots
A list of some public data sources:
• http://www.fema.gov . A lot of disaster management info.
• http://www.flooddamagedata.org/states.html. Flood Damage Data for States: (A non governmental website that monitors damage caused by floods. The data is collected from different agencies, including The National Weather Service).
• http://www.cdc.gov. The Centers for Disease Control and Prevention (CDC) is the lead federal agency for protecting the health and safety of the people.
• http://www.cdc.gov/ncidod/dvbid/westnile/surv&controlCaseCount03_detailed.ht m, West Nile Virus
• Statewide Hurricane hits: http://www.aoml.noaa.gov/hrd/Landsea/deadly/Table9.htm http://www.nhc.noaa.gov/paststate.html
• http://www.aoml.noaa.gov/hrd/Landsea/deadly/index.html, (This is a link to a paper which has further links to other datasets)
• http://www.nifc.gov/, Forest Fires
Please note. Calculations can be done across several columns in the table when needed. Therefore, one thematic map is not necessarily only for one column or field in the table. The map can show the combination of several columns, such as the population density (Population/Area) or disaster per year (total #disasters/total #years). You have various possibilities to choose a topic for the thematic map.
3. Requirements (please read carefully)
Submit through Blackboard (all in ONE zipped file !)
o a report in *.doc format (max 2 pages) o disaster data in *.dbf or *.xsl format o a map of Letter size in pdf format
To be described/discussed in your report
o Topic selection and its significance
o Map design (including necessary data preprocessing)
o The data classification method used/selected
o Outcome analysis and interpretation (patterns found)
o Others that you are interested
final maps and possible appendices would not count towards the page limit
Note the following items apply to all reports during the course
The report should be
o In Letter format
o With Font: Time (or Times New Roman), size 12, 1.5 line spacing
o 1” margin on all sides
Sample results and graphics should be included in your report for analysis
The final map product should be in printing quality (i.e., properly designed, including all necessary map components, ready for final publishing). It can be an appendix to your report
The final map should be in Letter format with 1” margins on all sides
2003 West Nile Virus Activity (an example)


4
5

Related Posts
 Email to Instructor
 Analysis of Innovative Company: “APPLE”
 Prepare 5 questions for EACH interview with a native Hispanic of African
 How are corporate scenarios used in the development of an effective strategy
 Five-forces model and a firm’s international business strategy
 Critical Review: To His Coy Poem